QEEG guided tPBM for drug addiction
- Nov 18, 2024
- 18 min read
A. SIGNIFICANCE
A.1 The Unmet Need: Opioid use disorders (OUD) affected 2.2% of Americans (or 6.1 million people) in 2021, and opioid-involved overdose deaths rose from 49,860 in 2019 to 81,806 in 2022, with a US economic burden of nearly $1.5 trillion in 2020 alone(1). Despite numerous advantages offered by pharmacological therapies in the treatment of opioid addiction, their notable side effects limit their effectiveness, with dependence and relapse rates reaching up to 65-70%(2). While pharmacological treatments successfully target withdrawal symptoms, they fail to address other neurobiological mechanisms involved in the addiction cycle.
A.2 Electroencephalography (EEG) as a biomarker in OUD: EEG (electroencephalography) has emerged as a promising biomarker for opioid use disorder (OUD) and other substance use disorders (SUDs), with research since 2000 increasingly linking EEG changes to treatment outcomes(3). Due to the complex interplay of inhibitory and excitatory postsynaptic potentials, which resemble oscillatory dynamics, EEG signals are computationally processed to be interpretable. Three common methods include: using event-related potentials (ERPs) to investigate neural activation during sensory, cognitive, or motor events, such as the P300 marker in schizophrenia; localizing cortical activity topographically, which are valuable in guiding epilepsy surgeries; and analyzing spectral oscillatory activity across the canonical frequency bands (e.g., delta, theta, alpha, beta, gamma) using quantitative electroencephalogram (qEEG), whereby time-series data are assessed via the Fourier transform algorithm(4). Such analyses are based on the principle that synchronization of rhythmic brain activity across a range of timescales is a fundamental organizing principle of the human brain (5,6). Spectral changes are interpreted in the context of normal vs abnormal oscillatory rhythms in specific frequency bands and their link to underlying neural processes (e.g., regulation of top-down vs bottom-up stimuli, gating information and communication, etc.)(5,7–9). Minnerly et al(10). compared EEG patterns of patients with opioid-, methamphetamine- and alcohol-use disorders. Patients showed a similar trend of EEG differences compared to healthy controls, such as increased delta and theta power and decreased posterior alpha power(10). Longitudinal studies indicate that EEG markers, such as increased cognitive P3 and decreased beta power, are associated with improved abstinence and recovery in SUDs(11–14). Although pharmacological and behavioral interventions have been studied for decades, only a few have used EEG biomarkers to assess treatment outcomes (15,16). While EEG's specificity as a biomarker for OUD is limited, its ability to track neural changes during abstinence and post-treatment supports a framework for precision psychiatry interventions, potentially improving prognostic outcomes for individuals with OUD and other SUD.
A.3 Transcranial photobiomodulation (tPBM) is a novel neuromodulation based on non-retinal exposure to light at specific wavelengths. tPBM with near-infrared radiation (NIR) has shown promising early results for treating neuropsychiatric disorders(17). Due to its low cost, excellent safety profile, and ease of self-administration, tPBM has the potential to become widely accessible.
A.3.1 tPBM Penetration in the Brain: A small but significant fraction of the light delivered to the scalp reaches the cortex(18–21). A 2% to 3% penetration rate of NIR is attainable at target PFC regions (expressed as fluence or flux or J/cm2). This corresponds to an NIR penetration of ~2 cm of intervening skin, skull, meninges, CSF, and brain. The NIR fluence (energy density, J/cm2) at the skin surface –necessary to reach target brain areas therapeutically– is safe and well tolerated. It is feasible to attain an NIR fluence on the human brain equivalent to the fluence-inducing neurological benefits in animal models(22).
A.3.2 tPBM Cellular Mechanisms: The NIR delivered through tPBM is absorbed by a mitochondrial enzyme and chromophore, cytochrome c oxidase (CCO), and is only minimally dissipated as thermal energy(22) (23). The peak absorption of light energy by CCO occurs at four different wavelengths; one of these peaks is 812–846 nm(24). PBM enhances mitochondrial activity(23,25,26). NIR delivers power to the CCO and stimulates the mitochondrial respiratory chain, leading to increased ATP production(23,25,26). Noticeably, opioids are linked to mitochondrial dysfunction and morphology, which may be associated with neuronal cell death(27–29). In addition, NIR promotes the dissociation of nitric oxide (NO) from the CCO(22), which is likely to act as a local vasodilator(30), resulting in a focal, increased CBF(31). Another possible PBM-positive action mechanism in OUD is the upregulation of the endorphins system(32) . There is evidence of the potential utility of PBM in OUD. In a previous randomized controlled trial (RCT) involving patients with opioid use disorder (OUD), photobiomodulation (PBM) –using 810 nm light, with an irradiance of 250 mW/cm2 and a fluence of 60 J/cm2– was administered unilaterally to the forehead over eight four-minute sessions spanning four weeks. Results indicated that active PBM significantly reduced opioid craving compared to a sham control group(33).
A.4 tPBM Safety and Tolerability: The safety of one session of tPBM was evaluated in three large RCTs with a pooled sample of 1,410 subjects with stroke (34–36). No significant difference in the rate of adverse effects was observed between the group receiving laser NIR (808 nm; 5W, 700 mW/cm2) or sham. No serious adverse events (SAEs) were found in our review of the literature(37). Two open studies using 1 and 6 sessions of tPBM reported no treatment-emergent side effects (33) (38). A clinical trial with 16 tPBM sessions reported an increased number of mild side effects in the active treatment group, the most frequent being insomnia, “seeing vivid colors,” “an ashtray-like taste,” and irritable mood(39). Other potential risks related to inappropriate administration will be mitigated by the safety procedures (Human Subjects section). The risk of thermal injury from PBM delivered with the parameters used in the studies we reviewed is considered minimal and limited to the skin. In ten individuals treated for TBI with 10-15W lasers –a much higher power than what would be used in the proposed study– the skin temperature increased to no more than 30°C with rapid cooling after removal of the NIR light. Clinically, patients reported slight skin warming but no discomfort (40). Laser devices have a potential risk of retinal lesions when misused; this is mitigated with appropriate safety eye gear and procedures; the use of laser is not proposed in this application, but light-emitting diodes (LEDs).
A.5 Pulse tPBM: tPBM has been used in both continuous and pulsed modes, with pulsed mode using light flashes at specific frequencies to provide stimulation. Neuromodulation using the pulsed method includes tACS, tPBM, and rTMS, which utilize the exact characteristics of low frequencies, driving EEG in a low-frequency direction and high frequencies in a high-frequency direction, also called “entrainment” of brain oscillations(41–44). Continuous-tPBM enhances higher frequencies overall, while pulsed-tPBM was found to tune up a specific spectrum while increasing stimulation at that specific frequency(45). In pulsed tPBM, various frequencies have been tried, including 5, 10, 20, 40, and 100 Hz. See Figure 1.
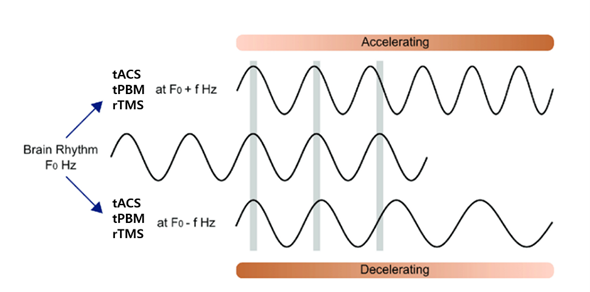
Figure 1. Schematic representation of neuromodulation using pulse frequencies to modulate brain waves with
corresponding pulse frequencies.
A.5.1 Probable mechanism of pulsed tPBM: In addition to the effects demonstrated with continuous tPBM, Pulsed tPBM is characterized by entrainment at the specific pulse frequency in use. The mechanism of Pulsed tPBM is not yet fully understood, but it can be analogized to the generation of brainwave rhythms. EEG rhythms are produced by the firing of many synchronized pyramidal neurons, as in the case of the alpha rhythm, the most prominent rhythm in the EEG, created by the simultaneous firing of neurons in the cortical area due to the pace-making of the thalamus. In the neuromodulation methods, such as tACS, tPBM, and rTMS, it can be understood that the pulse frequency used acts as another pacemaker to the pyramidal neurons in the specific target area at the rhythm of the corresponding stimulation frequency(46).
A.5.2. qEEG guided pulsed tPBM: qEEG is an inexpensive but effective tool to assess and localize brain activity and has been used in neuropsychiatry for diagnosing(47) and guiding treatment(48). It compares an individual's brain activity with normative data. This comparison helps identify abnormal brain function and offers a more objective measure of psychiatric disorders. By analyzing a constellation of qEEG characteristics, known as qEEG phenotypes, it is possible to guide personalized treatment and assess treatment effectiveness(49). The use of standardized and automated de-artifacting procedures enhances the reliability of qEEG data, making it a valuable approach for understanding neurodysfunctions, tailoring interventions, and improving diagnostic accuracy(9); in the field of neuromodulation, for example, pulsed stimulation has also been repeatedly shown in rTMS to be more effective when the frequency is selected according to the individual's EEG(50). Regarding tPBM, a recent study by Tang et al. also found significant improvements in tasks such as attention and memory with pulsed tPBM compared to continuous tPBM(51). In a recent study of a group of mild cognitive impairment patients, iMediSync found that pulsed tPBM based on the individual's qEEG improved cognitive function, evaluated by CDR and CDR-SB and reduced frontotemporal slow waves that contribute to cognitive decline.
B) INNOVATION
The project is innovative because it (1) tests transcranial photobiomodulation (tPBM) with near-infrared light, (2) uses qEEG to personalize treatment delivery to the OUD population, (3) evaluates qEEG as a biomarker for OUD treatment response (4) compares the effectiveness of a personalized PBM intervention versus a non-personalized PBM protocol. This project addresses the need for precision medicine approaches to improve clinical presentation by targeting brain circuit abnormalities in OUD.
B1. qEEG is a biomarker based on preliminary data derived from OUD behavioral presentations. iMedysinc, conducted a study with 46 male OUD participants, with a mean age of 34.2, using open-label qEEG-personalized tPBM. At baseline, we identified differences in the participants' qEEG patterns compared to healthy normative data(52), and these differences were categorized into phenotypes. This suggests that different neurophysiological states could underlie various clinical manifestations of the disorder.
1) Underarousal: This is characterized by increased slow-wave activity (delta and theta frequencies) in the frontal lobes. This pattern suggests cortical hypoactivation, leading to cognitive sluggishness and poor attention, which are common in OUD(53) (54) (55).
2) Overarousal: Marked by excessive fast beta waves, indicating heightened cortical arousal associated with anxiety symptoms and restlessness. This pattern is linked to impulsivity, poor cognitive control, and higher relapse risk(56).
3) Deficient Alpha Rhythm: A reduction or disruption in alpha wave activity, crucial for maintaining a relaxed but alert state. This deficiency can impair emotional regulation and cognitive processing (57) (58)
4) Asymmetric Alpha Rythm: Abnormalities in alpha rhythm, either too fast or too slow, may reflect trauma or chronic stress, influencing emotional and cognitive dysregulation(59).
5) Localized EEG Abnormalities: Focal spikes or unusual activity in specific brain regions, potentially indicating localized brain dysfunction. These abnormalities can guide targeted treatment approaches by highlighting specific brain areas affected by OUD.
Understanding these EEG-based phenotypes can help develop personalized treatments to improve cognitive function, emotional regulation, and overall outcomes for individuals with OUD.
B.2 qEEG-guided pulsed tPBM and clinical effects in OUD: After eight weeks of personalized-qEEG PBM intervention delivered to patients with OUD, significant improvements were observed in the Pittsburgh Sleep Quality Index (PSQI), Beck Depression Inventory (BDI), State and Trait Anxiety Inventory (STAI), and Perceived Stress Scale (PSS). Substance craving showed improvement but was not statistically significant. See Figure 2.
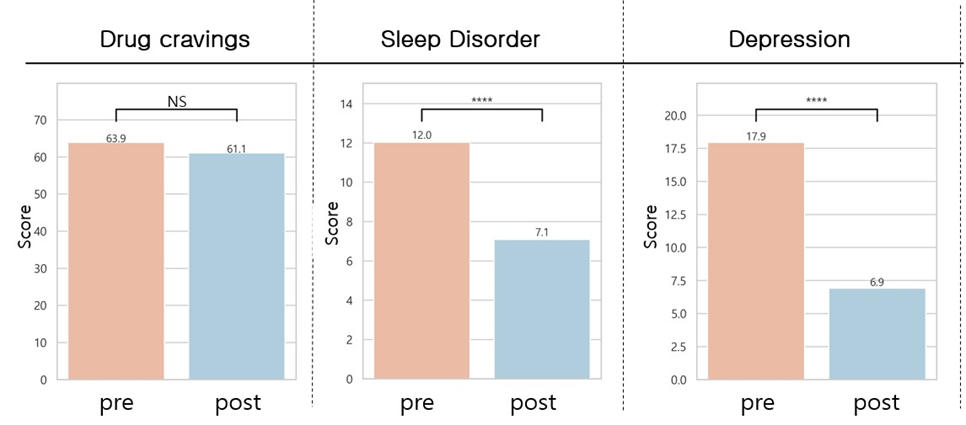
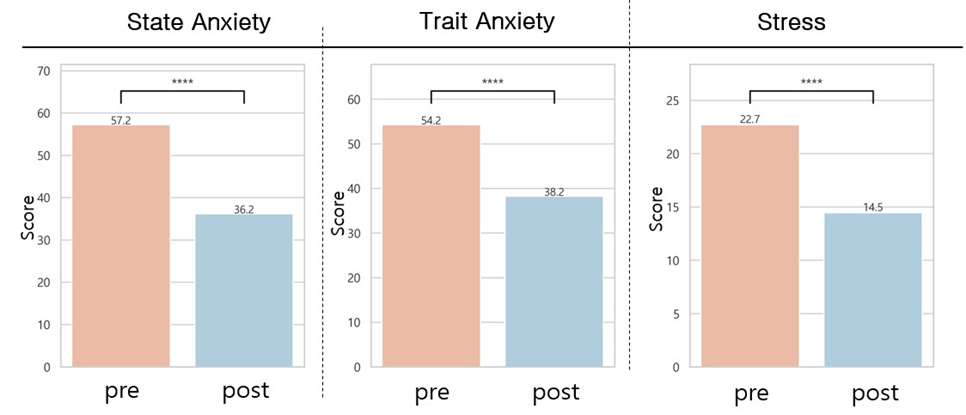
Figure 2. Comparative pre- and post-tPBM intervention on craving index, sleep, depression, anxiety, and stress
B.3 qEEG-guided pulsed tPBM and spectra effects in OUD: Regarding qEEG absolute power spectral analysis, we found a significant increase in posterior alpha 2 (i.e., the higher alpha band, 10-12 Hz), correlated with improvement in self-relaxation and mood, as shown in Figure 3.
Figure 3. qEEG Topographic map of the absolute posterior alpha 2 (10-12 Hz) at baseline and post-treatment.
We found statistically significant qEEG power spectrum changes towards normalization (according to a healthy control database) during the resting state, demonstrated by the following improvements: Reduction of Abnormal Alpha Peaks in temporal and parietal regions (4 variables; P3, P4, T4, T6); Normalization of the Theta over Alpha Ratio (TAR) in the occipital region (2 variables; O1, O2); Normalization of the Delta over Alpha Ratio (DAR) in the temporal region (1 variable; T4), Normalization of the Alpha asymmetry in Parieto-Temporal-Occipital Region (1 variable). Based on these findings, we developed a composite outcome to build a model using an informed machine-learning approach validated with an independent data set. The composite qEEG model score showed statistically significant changes toward qEEG normalization (see Figure 4) after the study intervention and correlated with the subjects’ clinical presentation of craving and sleep quality (R=-0.27, -0.31).
Compound QEEG formula= Y = (1.0661)*x1 + (0.5926)*x2 + (0.5496)*x3 + (0.2033)*x4 + (0.6234)*x5 + (1.3650)*x6 + (0.2495)*x7 + (0.0743)*x8
To develop the model score, we compared each qEEG feature pre- and post and found candidates that showed statistically significant differences. We applied those features to Machine Learning Algorithms (Gaussian SVM regression) to develop the best formula to describe changes between pre-post intervention. 5-fold cross-validation was applied for training and testing.
The qEEG patterns of individuals with SUD are heterogeneous and can be categorized into different types of qEEG endophenotypes. However, setting different qEEG features as endpoints for each endophenotype to evaluate the efficacy of tPBM would become complex, and the effect size could vary across endophenotype groups. Therefore, we developed and validated a universal compound qEEG index using machine learning (ML) to assess the efficacy of tPBM with a single qEEG endpoint across different endophenotype groups.
The pre-post intervention effect size using the same composite model score from another recently concluded tPBM in OUD study intervention study (n=36, 24 sessions over 5 weeks) was 0.47. Given that the validity of our model was confirmed in an independent sample, using this model to calculate the effectiveness of drug addiction interventions is a reasonable approach.
Summary: Why test tPBM dose with qEEG? An innovative therapy would not be clinically justified unless it adds significant value in terms of risk/benefit. The limitations of current treatments in OUD are well documented. Mounting data suggests that tPBM could be a novel treatment strategy in OUD. However, efficacy data have yet to warrant FDA approval. Personalized qEEG-based tPBM might be the necessary step to optimize the treatment effects. This study pilots a novel measurement of change in the qEEG power spectrum as a marker of change for brain neurophysiology in the search for the optimal tPBM protocol strategy. We test the use of Personalized qEEG-based tPBM with the long-term goal of transforming clinical practice for patients with OUD. If the effects of Personalized-based tPBM are confirmed, the present study will support the development of an innovative approach that could be applied to other substance use disorders.
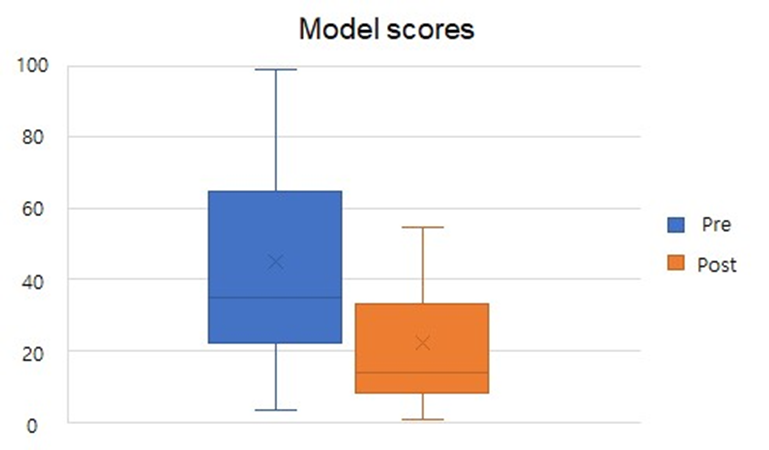
Figure 4. Pre- and post-intervention changes in composite model score for all study participants.Pre-intervention(blue), Post-intervention (orange).
C. APPROACH
C.1. Target: Our goal is to demonstrate target engagement of Personalized qEEG-based tPBM by showing post-intervention qEEG compound outcome normalization.
C.2. Protocol for deriving the proposed objective evidence of target engagement Since tPBM has different effects depending on the frequency used and the location of the stimulation, like rTMS or tACS, the effectiveness of neuromodulation techniques can be ensured by providing stimulation both at the right frequency and at the right location for each patient, based on their EEG patterns. Still, most tPBM devices only provide stimulation without EEG measurement, precluding personalized protocols for precision medicine. On the otherhand, iMediSync, has established quantitative EEG-based tPBM protocols through initial consensus with global experts who have utilized qEEG and tPBM in their practices and who have tested the same protocols in healthy adults, patients with mild cognitive impairment, and patients with SUD treated in rehabilitation settings. Table 1 shows the features of the proposed qEEG-guided tPBM protocol.
tPBM based on qEEG can provide personalized protocols according to individual neurophysiological profiles, enabling optimized treatment according to the diverse clinical presentations of patients with OUD. In particular, the qEEG patterns in people with SUD can be heterogeneous due to phenotypic variability based on the stage of SUD, the substance of abuse, and the individual's underlying mental health conditions, personality, and clinical features. Categorized tPBM protocols will be tailored to individuals’ qEEG patterns.
Table 1. Examples of personalization protocol based on qEEG
No | qEEG phenotype | tPBM protocol example | ||
1 | Sustained Alpha rhythm in eyes-open | Whole brain tPBM with Beta1(12-15 Hz) |  | |
2 | Absent alpha rhythm or spindling beta rhythm in eyes close | Whole brain tPBM with alpha (10Hz)+1Hz |  |  |
3 | Asymmetrically enhanced Alpha in posterior area (higher than ipsilateral occipital alpha or contralateral alpha at same area) | Whole brain tPBM with alpha (10Hz) + local Beta1(12-15 Hz) at the area with asymmetrically enhanced alpha | |  |
4 | Local slowing rhythm (enhanced delta, theta or slow alpha, beyond 1 z score at comparison of normative EEG pattern) | Whole brain tPBM with alpha or beta1 + local Beta2(15 to 20 Hz) at that locally slowed area | |  |
C.2.1. qEEG and tPBM treatment protocol: We used the iSyncWave, a dry EEG headset (FDA220056) capable of measuring 19 channels of EEG at the international 10-20 standard electrode placement and capable of providing tPBM care. iSyncBrain (FDA222838) is a software medical device that automatically inputs the EEG measured by iSyncWave to the cloud, performs AI-based denoising, and compares it to a healthy normative database of all ages and sex to determine an individual's qEEG pattern(52). iSyncBrain's web interface provides tPBM tailored to an individual's qEEG. The iSyncWave tPBM has a max irradiance of 21.9 mW/cm2 and a max. light output of 43.7 mW. The max fluence at 20 minutes of use is 26 J/cm2. The routine protocol based on the individual's qEEG is 10 to 20 minutes per session, three sessions per week, and eight weeks of care as the default program. See Figure 5.
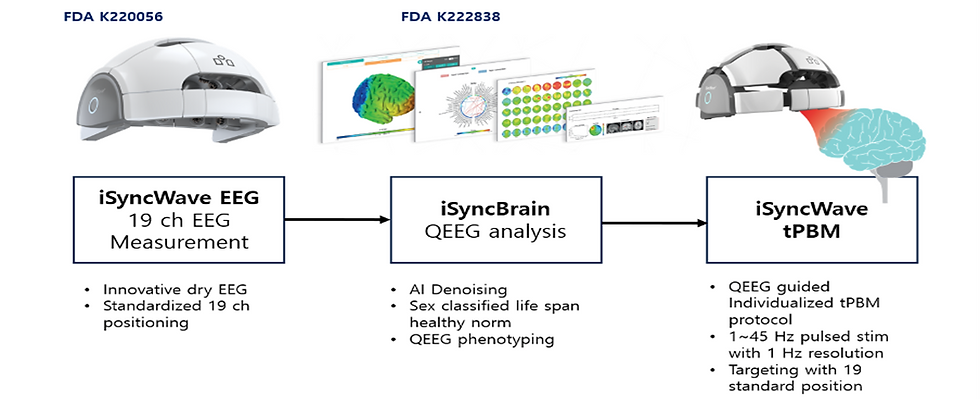
Figure 5: Study device
References
1. Understanding the Opioid Overdose Epidemic | Opioids | CDC [Internet]. 2023 [cited 2024 Mar 5]. Available from: https://www.cdc.gov/opioids/basics/epidemic.html
28. Cunha‐Oliveira T, Rego AC, Garrido J, Borges F, Macedo T, Oliveira CR. Street heroin induces mitochondrial dysfunction and apoptosis in rat cortical neurons. Journal of Neurochemistry. 2007 Apr;101(2):543–54.
Comments